
Who doesn’t know them? So-called “reports” which are mostly rather “statistics” and come without any meaningfulness or added value. The only constant that recurs again and again is that nothing is repeated.
Every report, every presentation of figures is always an individual work of the creator. Strange, because so much in the corporate world today follows a standard. But even outside of our everyday work we find uniform standards, some of which are even understood worldwide. Such as traffic signs or music notation, drawing plans by architects or street plans.
However, a comprehensible and uniform report notation and presentation of company figures is rarely considered. The figures from a BI system are a central component of corporate management. And yet it seems as if everyone is allowed to follow his own ideas in order to present the management with the basis for decision making.
A report that looks good is not necessarily a (good) report
But how do you come to a definition of how to best present reports and presentations? Prof. Dr. Rolf Hichert and Dr. Jürgen Faisst asked themselves this question a few years ago and answered it with the “International Business Communication Standards (IBCS®)”.
IBCS® consists of a comprehensive notation manual based on the SUCCESS Rules. The acronym SUCCESS stands for:
- Say -> get the message across
- Unify -> Unify meanings
- Condense -> condense information
- Check -> Quality assurance
- Express -> Correct visualization
- Simplify -> Avoiding disorder
- Structure -> Structure contents
By following these rules, we are now able to create a standardized reporting system that every employee can read, interpret and understand.
Uniform notation is revolutionizing internal and external reporting
The standardization of the reporting system leads to a decisive basis: recognition value!
True to the motto “Man is a creature of habit”, it is thus easier to read and create reports and statistics. This applies to all employees involved, regardless of whether they have a long service record or have been newly hired.
IBCS® colouring is predominantly black and white / grey, thus ensuring that only information relevant to decision-making is highlighted in colour and thus stands out from the mass of other figures.
By applying the IBCS® rules, it becomes clear that many of the important reports are not really reports but statistics.
While statistics simply represent values, reports convey a message that is relevant to the recipient, and this message can change in the same report depending on the behavior of the key figures.
With IBCS®, relevant information can also be extracted from statistics overloaded with numbers and passed on as a report.
With this gained efficiency, the correct presentation of key figures, clear messages and the support from the C-level, this concept offers clear statements and a solid basis for management decisions.
The introduction of IBCS© in your company is usually divided into several phases. First of all, the most important decision makers have to be behind the concept, this is often associated with persuasion. Once this step is done, a notation concept based on IBCS© is created that is suitable for your company. In doing so, possible CI rules and colors are taken into account. With this a basis is then created. This is followed by training of users and report creators and conversion of existing statistics, reports and presentations.
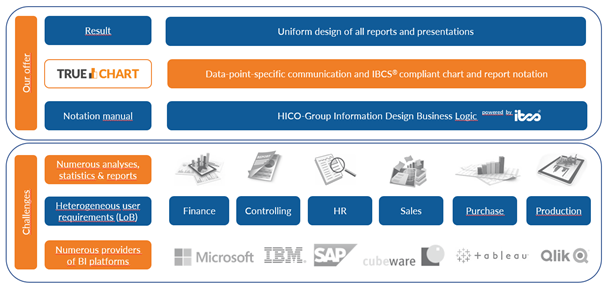
TRUECHART as a perfect complement to your BI system
The notation manual is the first step towards a uniform visualization in the company. However, the implementation and introduction of the visualization rules is usually a very complex and cost-intensive project. With TRUECHART the notation manual can be easily implemented into your existing BI system. It does not matter whether you use QlikView, QlikSense, Microsoft PowerBI or Jedox. In addition, TRUECHART offers the possibility to comment data point specific and to collaborate within a report.
Making right decisions through reports which provide real added value
One thing is certain, the speed at which companies must make decisions to remain competitive continues to increase. This is not the only reason why it is essential to base decisions on objective and uniformly presented facts. Nothing causes more chaos than wrong decisions based on misinterpreted or misrepresented figures. With the notation concept of IBCS© and the software solution TRUECHART the right decision and collaboration reaches a new level.
Stay up-to-date with TRUECHART. Follow us on Linkedin.