Extend the Possibilities
of Your Qlik reports
Key Features
Key Features
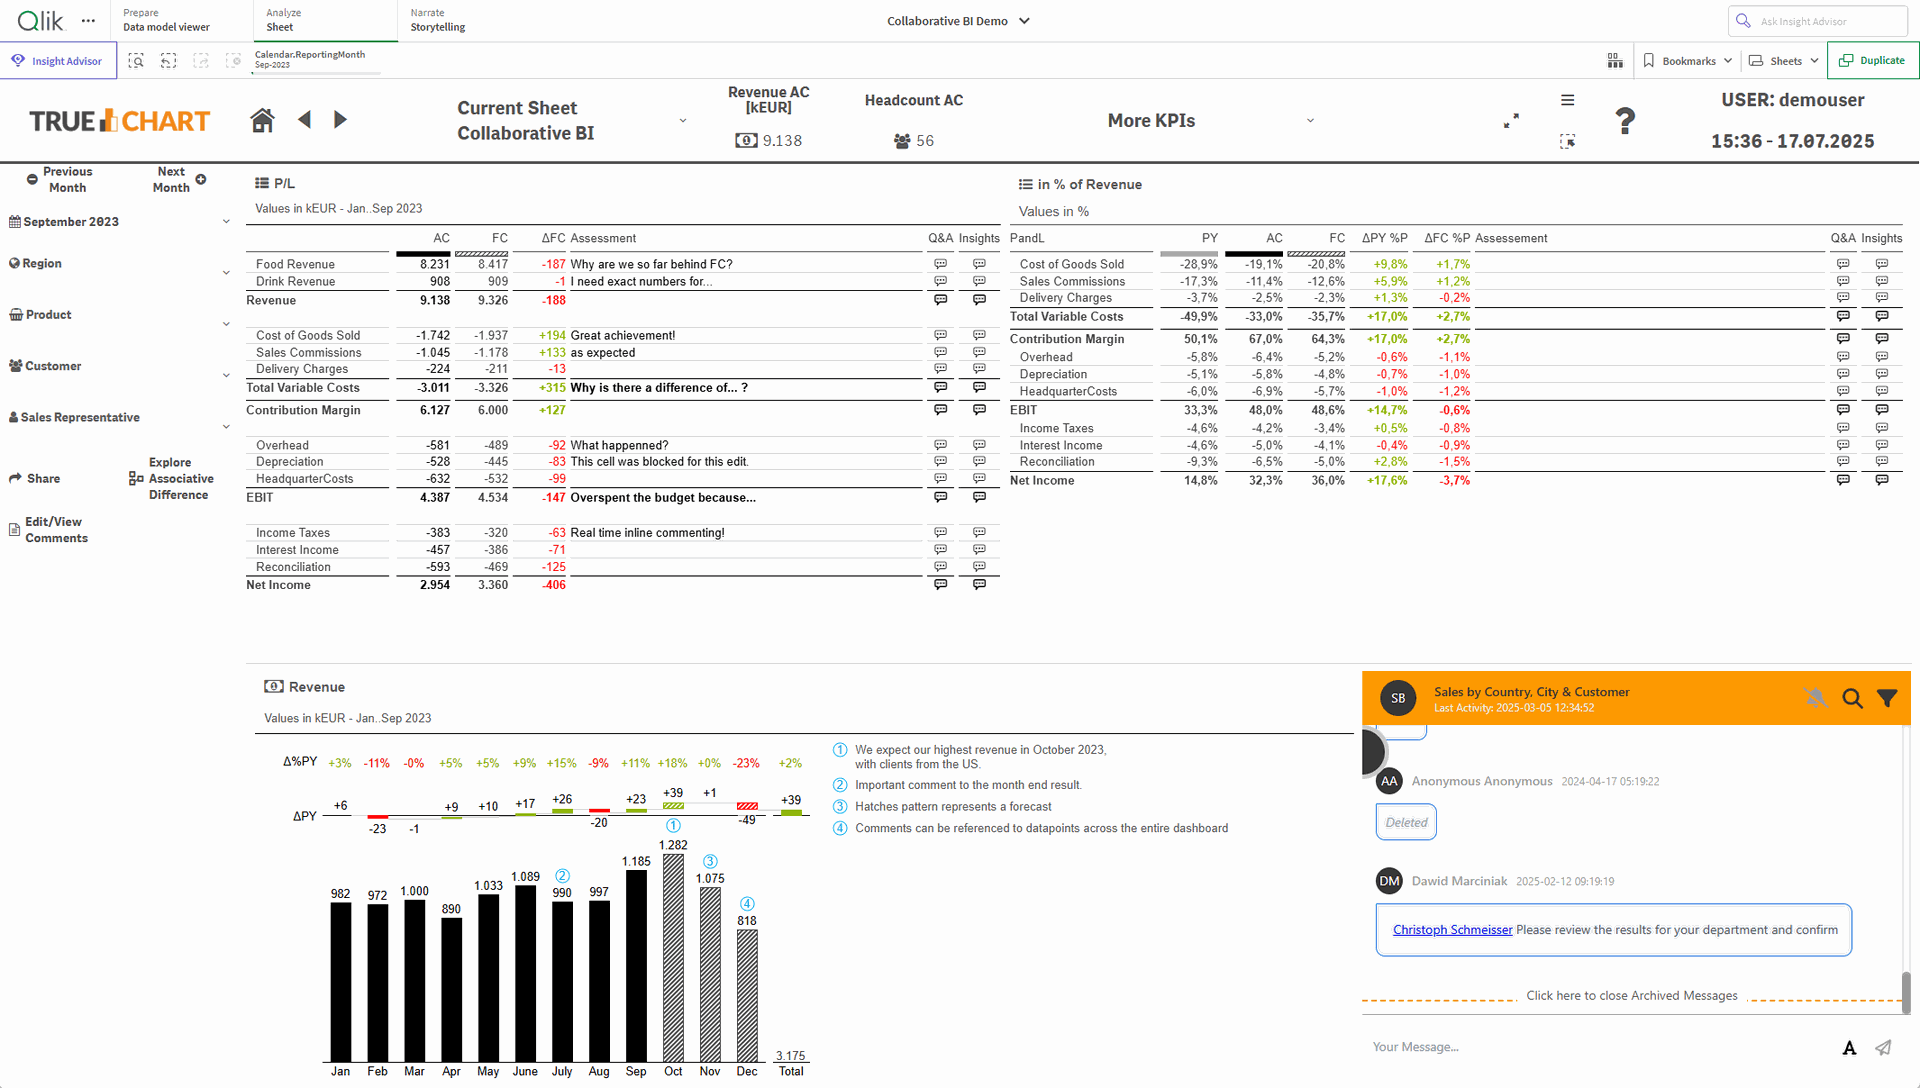
Build standardized, clear, and professional charts effortlessly.
Customize and create complex visualizations with ease.
Add data-point-specific comments to enhance collaboration and decision-making.
Works flawlessly with Qlik and PowerBI.
TRUECHART enables clear, consistent, and collaborative reporting by unifying teams, saving time, and seamlessly integrating with your BI tools.
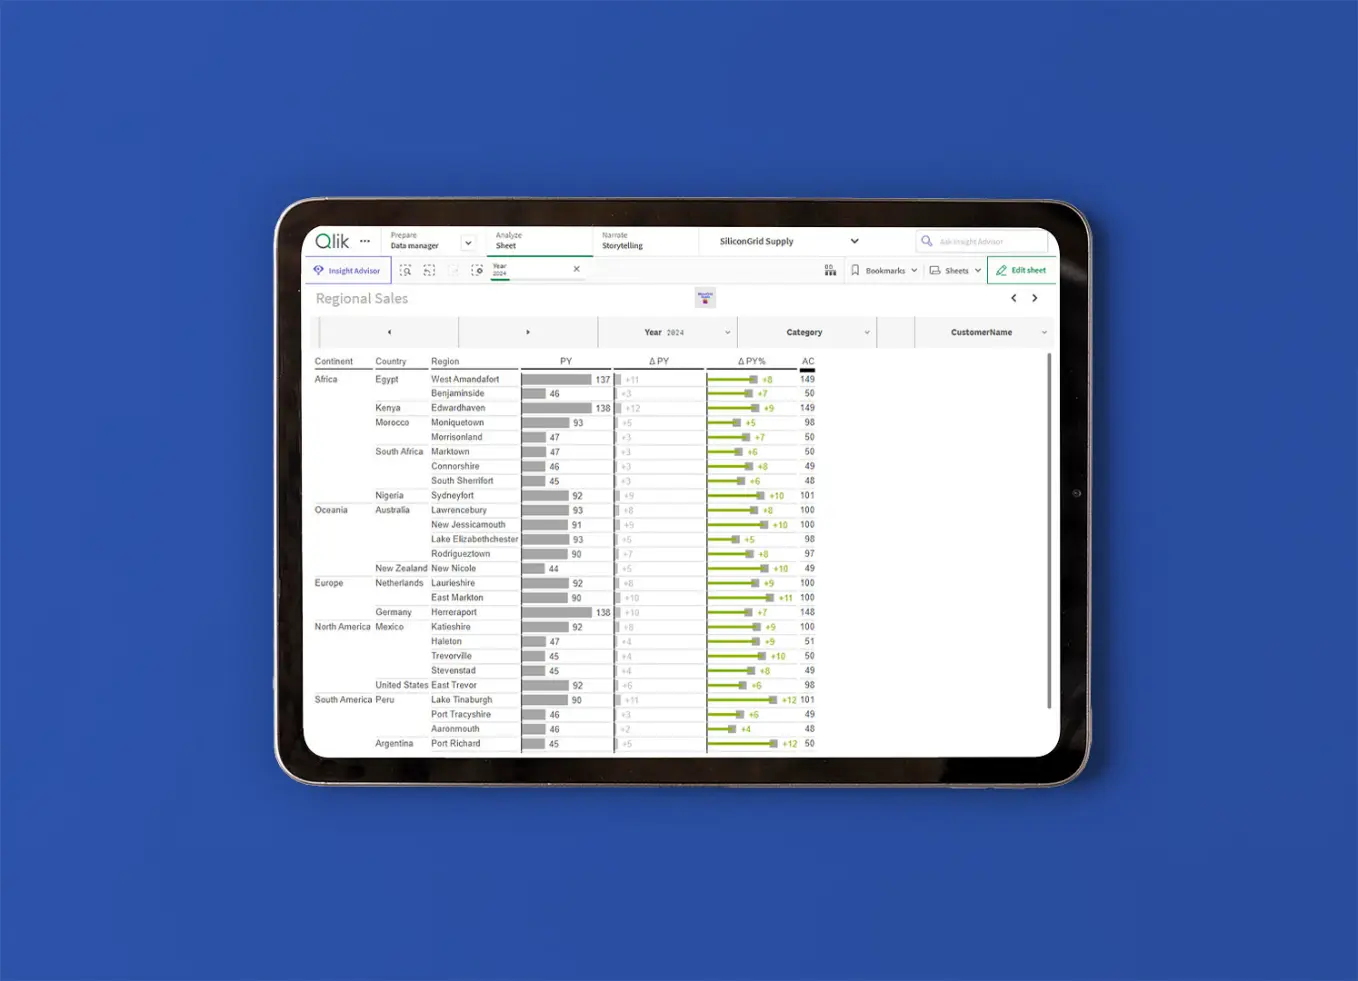
TRUECHART for Qlik Sense
TRUECHART reduces the time required both to prepare reports, and also for the consumer to review and understand the content being presented by fully-enabling the International Business Communication Standards (IBCS®) in any corporate environment. Creating and displaying data using IBCS® within your BI results in uniform data visualizations that offer dynamic, meaningful reports giving your business a valuable strategic advantage.
Trusted by data &
analytics leaders across
DACH and beyond
analytics leaders across