

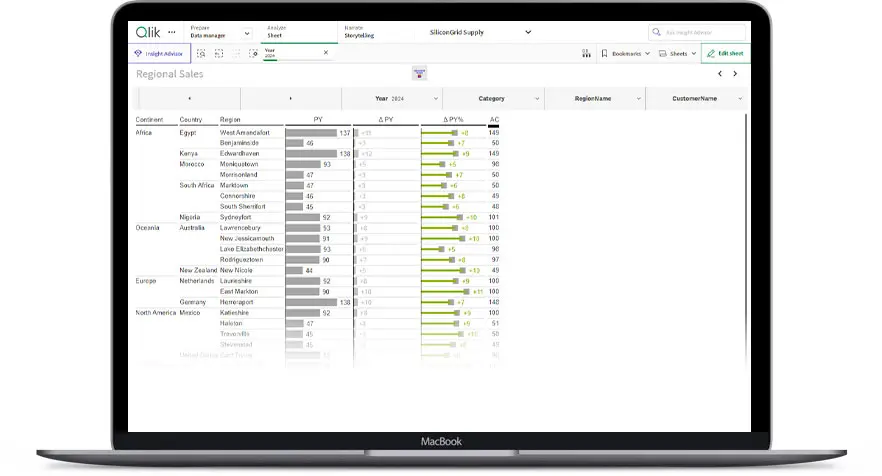
TRUECHART+ is Lite Planning, Pivoting and Visual Design in One Table.

Tailored dashboards for
better decisions
TRUECHART product family
which aligns you with market standards
-
TRUECHART+
 Experience the next levelTRUECHART+ introduces a brand-new user interface and improved experience across all features. Discover a more intuitive design, faster performance, and intelligent enhancements that redefine how you interact with business intelligence.
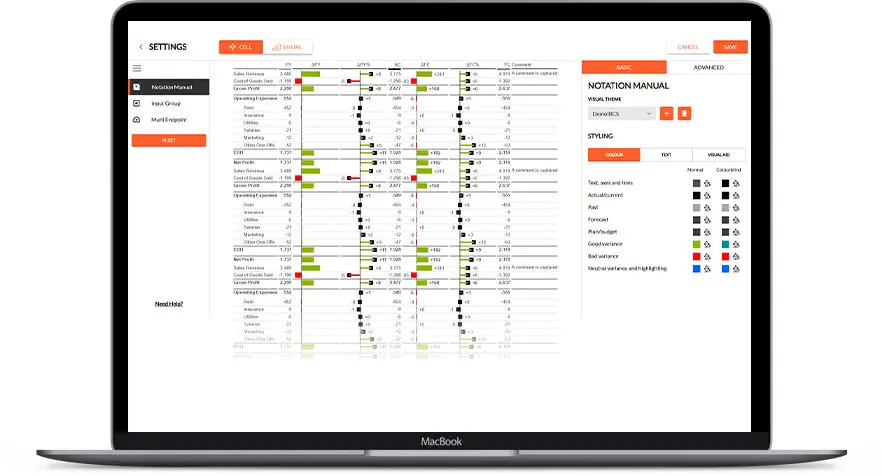


Collaborative Business Intelligence for Value-Driven Decisions of well known brands.
The differences to realise
your data analytics ambitions
IBCS improves business communication with standardized, clear, and comparable data presentation for better decision-making.
Allow teams to drill down into details or scale up to broader trends without losing context, enhancing strategic alignment.
Streamline your planning efforts with an effective and efficient software solution integrated into your analytics environment.
The new TRUECHART+
TRUECHART+ now supports multiple write-back scenarios, enabling seamless data updates across various platforms and use cases. It also allows splashing of numbers via hierarchies, simplifying data distribution and aggregation across organizational levels
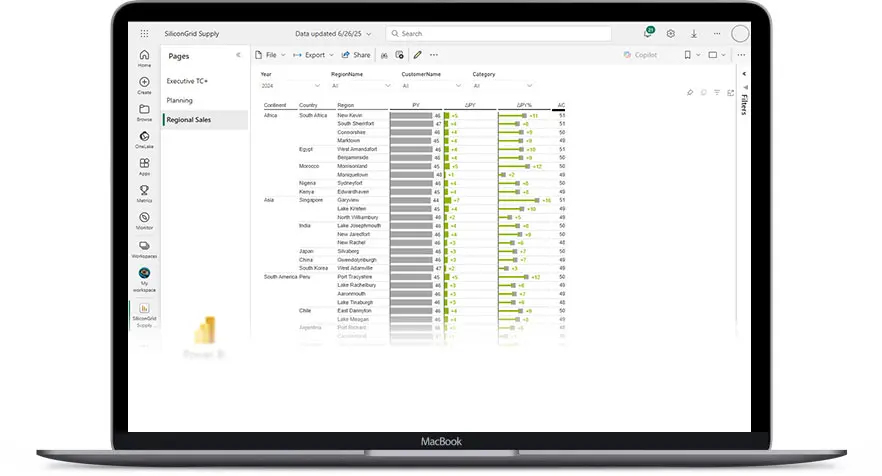
TRUECHART+ now enables any table to be transformed into a pivot table, offering flexible data analysis across diverse datasets. It also allows freezing pivot statuses for hierarchical presentations, preserving indents and structure for clear, consistent reporting.
TRUECHART+ Multi-Endpoint enables writing back data to case-dependent endpoints, ensuring flexible and targeted data updates. It supports seamless integration with MS SQL, Postgres, Snowflake, and MySQL for robust database connectivity.
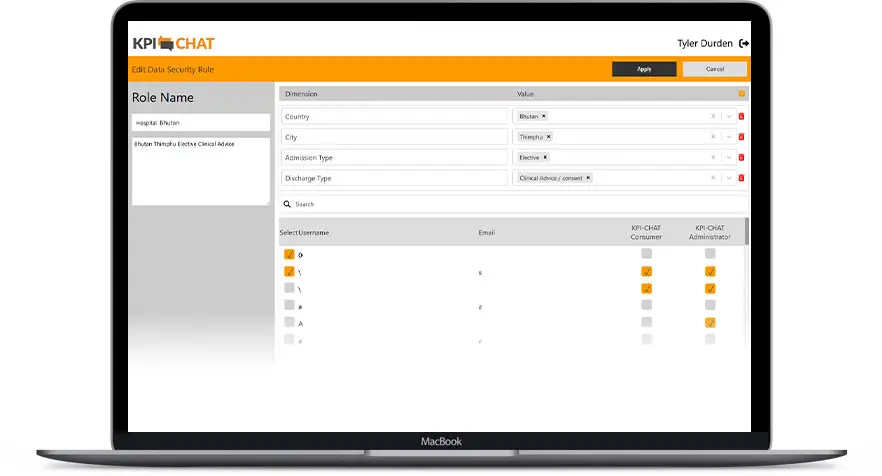
TRUECHART+ supports multi-tenant environments, allowing multiple clients or departments to work securely and independently within the same infrastructure. It ensures data isolation and centralized administration.
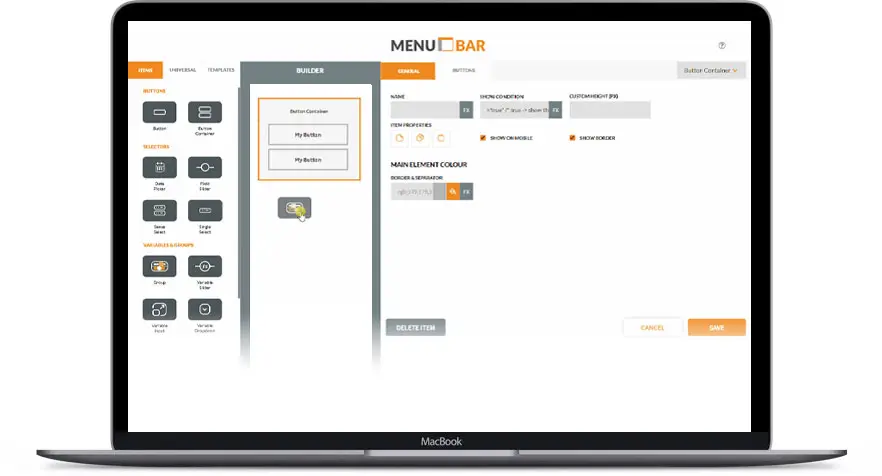
TRUECHART+ Reimagined UX/UI offers the fastest way from data to a designed business case, streamlining the creation of impactful visualizations. Its intuitive interface enhances user efficiency, enabling rapid development of tailored business solutions.
See how others reached the next
stage in their data maturity
-
 SULZER
Colleagues were used to waiting several minutes for the report when they ran it. If a selection was changed within the query, it was a case of waiting again. With the QlikView app, several minutes turned into a few seconds.
 Steffen LangeHead of Business Intelligence
Sulzer AG -
 SIEMENS
When I saw TRUECHART, I was impressed. The Qlik extension fits perfectly with my BI strategy for purchasing and frees up valuable time for operations.
 Nicolas MichelProduct Manager Procurement,
Procurement Controller Siemens